For independent developers, solo founders, and early-stage startup teams, deploying a new application introduces an immediate operational requirement: monitoring. When a project goes live, the team needs to know if the application is offline, if the code is generating errors, or if scheduled background tasks are failing to execute.
Historically, securing these insights required patching together multiple different software services or paying for comprehensive enterprise observability platforms. Both approaches introduce friction for early-stage projects. Enterprise platforms are often too expensive and complex, while patching together free tiers of different tools leads to fragmented data and alert fatigue.
Tinymon is a software platform built explicitly to address this gap. It treats the three fundamental pillars of application monitoring error tracking, uptime monitoring, and cron job tracking into a single workspace for a flat monthly fee.
This guide provides an objective, deep-dive analysis of Tinymon. We will explore the specific technical problems it solves, examine its core features in detail, break down its integration process, and evaluate how it compares to industry-standard enterprise solutions.
1. The Monitoring Dilemma for Early-Stage Teams
To understand the utility of Tinymon, it is necessary to examine the current landscape of application monitoring and how it impacts early-stage development teams.
When a developer ships an application, they generally need to track three distinct failure states:
- Application Errors: The code executes but encounters an exception (e.g., a database connection fails, or a variable is undefined).
- Downtime: The web server or hosting provider goes offline completely, making the application inaccessible to users.
- Silent Failures: Scheduled background tasks (cron jobs), such as nightly database backups or automated email dispatches, fail to run at their designated times.
The Fragmentation Problem
In the current market, these three failure states are typically handled by three separate categories of tools. A developer might use one service for error logging, a second service to ping their website every five minutes, and a third service to monitor background worker tasks.
Managing three separate services creates operational overhead. Developers must configure separate alert channels, manage three different billing cycles, and jump between different dashboards when diagnosing an issue. If a server goes offline, the uptime monitor will send an alert, but the error tracking software might simultaneously send a flood of timeout errors, creating unnecessary noise.
The Enterprise Overhead Problem
The alternative to fragmented tools is an all-in-one enterprise observability platform. While these platforms are highly capable, they are designed for large engineering organizations. They include deep performance profiling, distributed tracing across dozens of microservices, and compliance features like Single Sign-On (SSO).
Because of these advanced features, enterprise tools usually employ complex billing models. They frequently charge "per-seat" (scaling up as you add more developers to your team) or charge based on the exact volume of data ingested. For an early-stage team with a limited runway, unpredictable monthly bills and complex feature bloat are active deterrents.
Tinymon is designed to sit directly between these two extremes. It provides the three necessary tools in one interface, without the enterprise complexity or the fragmented billing.
2. Platform Overview: What is Tinymon?
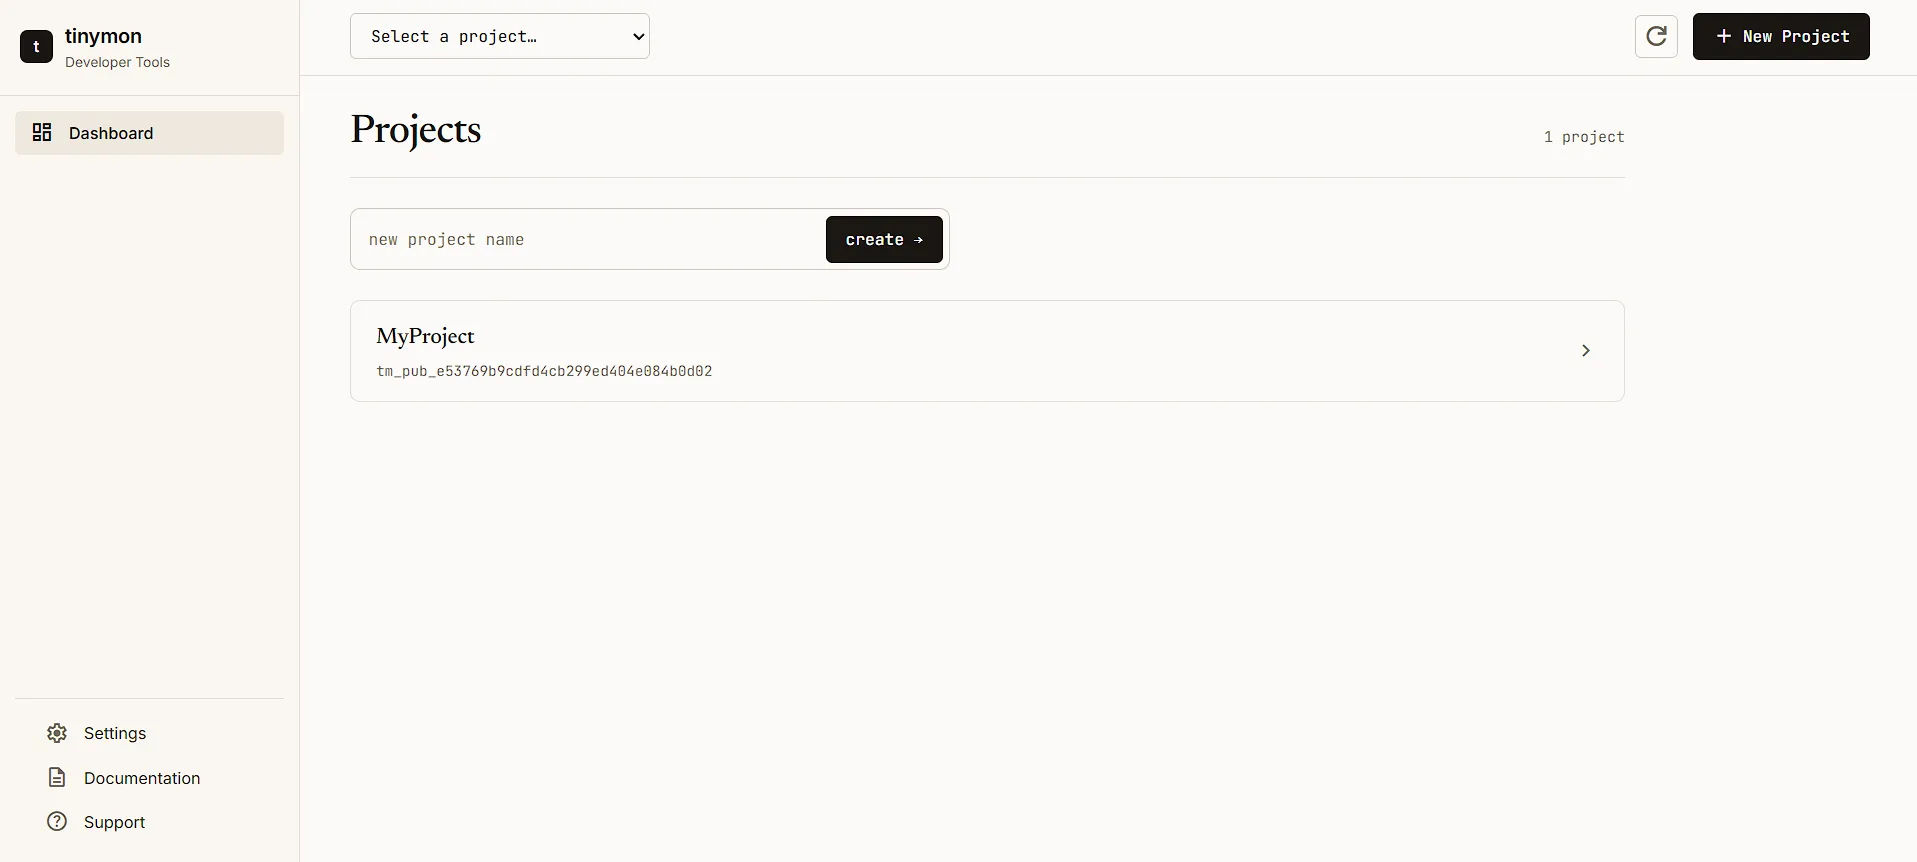
Tinymon is a lightweight, unified monitoring dashboard. It is built to watch multiple projects whether they are primary startup applications, weekend side projects, or API servers from a single interface.
The software operates on a strict flat-rate pricing model, allowing developers to add an unlimited number of projects without increasing their monthly subscription costs. By stripping away tracking options like deep web analytics tabs, performance profiling, and enterprise compliance requirements, the platform focuses entirely on answering one question: Is the software currently broken?
The platform organizes its functionality into three core pillars: Errors, Uptime, and Cron.
3. Core Feature 1: Error Tracking
The primary function of Tinymon is catching and logging unhandled exceptions in your application's code. When your application throws an error, the Tinymon SDK intercepts it, gathers the relevant context, and sends it to your dashboard.
Deduplication and Fingerprinting
If a bug in a web application affects 500 users, generating 500 individual alerts is actively harmful to a developer's workflow. This is known as alert fatigue. Tinymon manages this through fingerprinting.
When an error is captured, the system analyzes the stack trace and the nature of the exception. It groups identical errors into a single "Issue." Instead of 500 alerts, the developer receives one alert stating that a new issue has occurred, with a counter indicating how many times it has triggered and how many users were affected.
Supported Environments
Currently, Tinymon provides native SDKs for several major programming environments and frameworks:
- JavaScript & TypeScript: This covers Node.js backends, browser-based frontend applications, Deno, Bun, and serverless edge functions like Cloudflare Workers.
- Python: Includes integrations for popular frameworks like Django, Flask, and FastAPI.
- Ruby: Includes integration for Ruby on Rails.
- Java: Offers native integration for JVM-based ecosystems, expanding capabilities to setups or backend APIs built with Spring Boot.
For languages not yet officially supported via an SDK, developers can still log errors using Tinymon’s standard REST API.
Source Maps and Stack Traces
Modern JavaScript applications are usually minified and bundled before deployment to reduce file sizes. This makes standard error stack traces unreadable, as the code no longer matches the original source files. Tinymon supports source map uploads. When an error occurs in a production environment, the platform uses the source map to "un-minify" the code, showing the developer the exact file, line number, and function where the crash occurred.
Regression Auto-Reopen
One of the most practical workflow features in Tinymon is how it handles resolved bugs. When a developer patches a bug, they can mark the issue as "Resolved" in the dashboard. The issue is removed from the active list and silenced.
However, if that exact same error occurs again in a future deployment, Tinymon automatically reopens the issue. It tags the issue as a "Regression," notes the specific release version where it reappeared, and triggers a new alert. This ensures that silent regressions do not go unnoticed.
4. Core Feature 2: Uptime Monitoring
While error tracking tells you if your code is failing, uptime monitoring tells you if your infrastructure is accessible.
The Checking Mechanism
Tinymon’s uptime monitoring does not require any code installation. From the dashboard, a user simply inputs a target URL (e.g., https://api.yourdomain.com/health). Tinymon’s external servers will ping that URL on a set schedule either every 1, 5, or 10 minutes. The system uses standard HTTP GET or HEAD requests.
Users can configure the expected response. They can mandate that the server must return a specific status code (like 200 OK), or they can configure it to accept any standard 2xx success code.
Preventing False Positives
Internet routing can sometimes experience transient, momentary hiccups that resolve themselves in seconds. To prevent false positive alerts, Tinymon employs a failure threshold. By default, the system requires a URL to fail two consecutive checks before it officially flags the endpoint as "Down."
Once an endpoint is marked as down, the platform routes alerts to the configured channels. Just as importantly, it continues checking the URL and will send a "Recovery" alert the exact minute the server comes back online. The dashboard retains a history of these checks, providing a rolling 24-hour uptime percentage.
5. Core Feature 3: Cron and Heartbeat Checks
Cron jobs are scheduled tasks that run in the background of a server. Common examples include a script that generates invoices on the first of the month, a nightly database backup, or a worker that clears temporary cache files every hour.
Because these tasks run silently in the background, standard error tracking and uptime monitoring often fail to catch them. If a server goes offline, an uptime monitor catches it. But if a background worker simply fails to start its scheduled routine, the server stays online, no error is thrown, and the failure remains silent.
The Inverse Monitoring Concept
Tinymon solves this using "Heartbeat" monitoring. This is the inverse of uptime monitoring. Instead of Tinymon pinging the user's server, the user's scheduled task pings Tinymon.
When a developer creates a heartbeat monitor in the dashboard, Tinymon generates a unique URL. The developer adds a simple HTTP request (like a curl command) to the very end of their cron script.
Periods and Grace Windows
The developer configures two time settings in Tinymon:
- The Period: How often the job is supposed to run (e.g., every 24 hours).
- The Grace Window: How much delay is acceptable (e.g., 2 hours).
If Tinymon receives a ping at 2:00 AM, it expects the next ping by 2:00 AM the following day. If 4:00 AM arrives (the period plus the grace window) and no ping has been received, Tinymon officially marks the job as "Missing" and triggers an alert. The moment the cron job finally executes and pings the URL, the system clears the missing status and issues a recovery notice.
6. Developer Experience and Integration
A monitoring tool is only effective if a team actually integrates it. Tinymon explicitly focuses on reducing integration friction, optimizing for a quick configuration process.
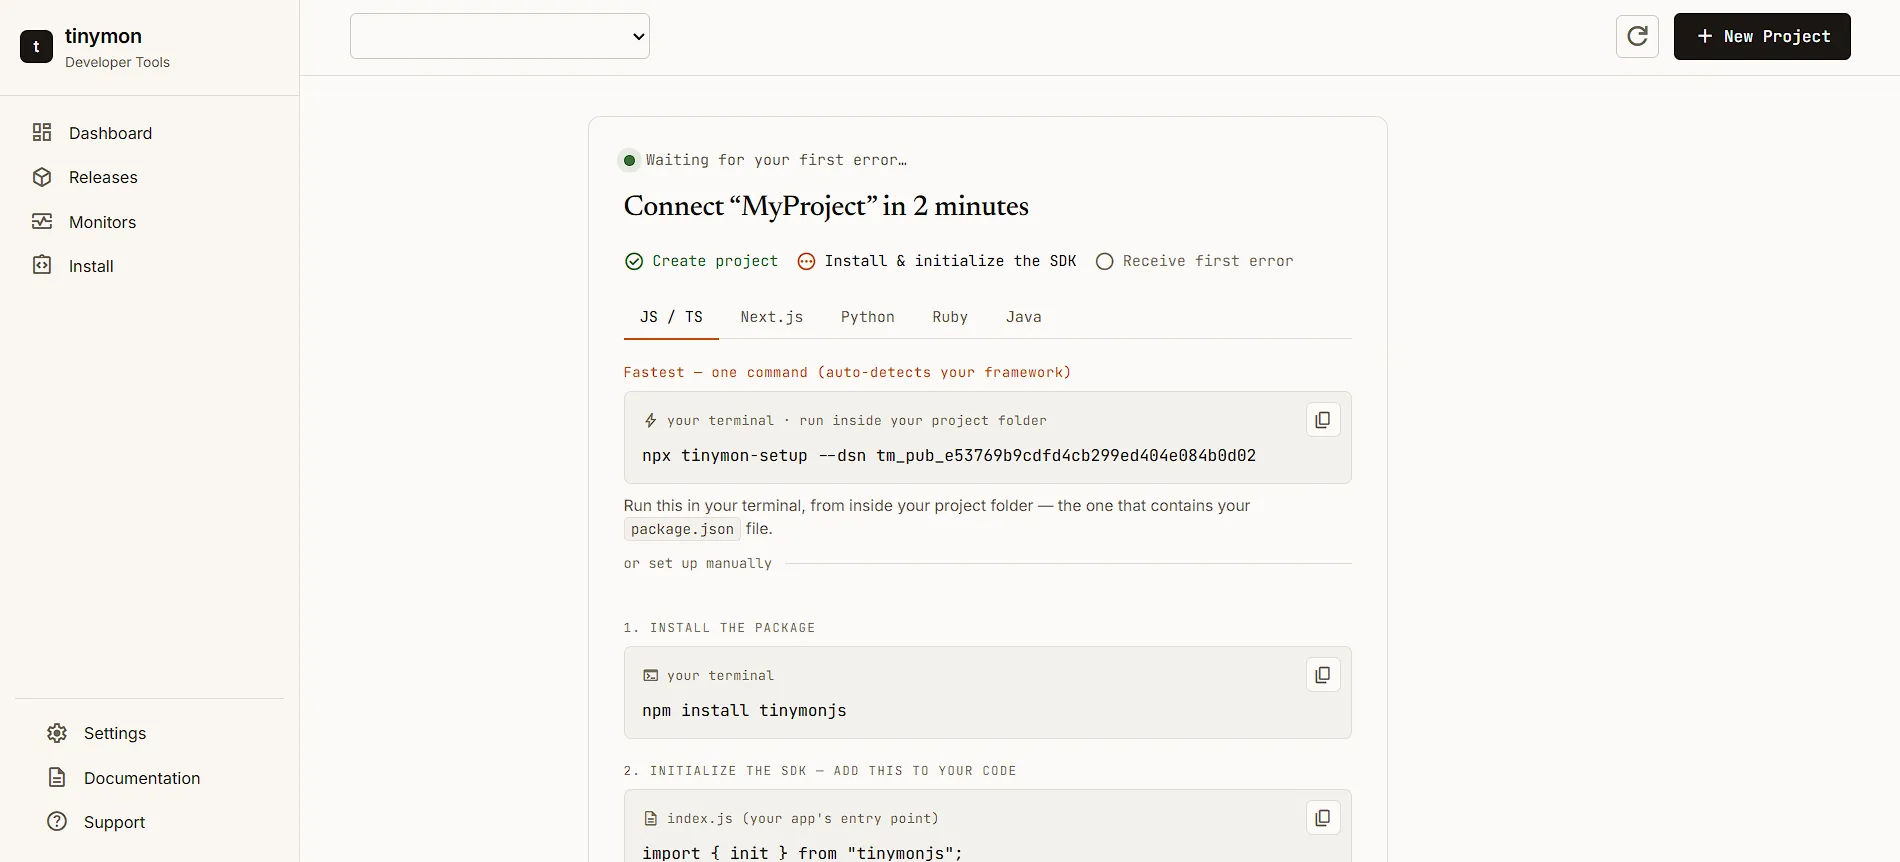
Automated Setup for JavaScript and Next.js
For teams working in the JavaScript ecosystem (specifically Next.js and standard Node environments), Tinymon provides a single-command setup process. By running npx tinymon-setup in the terminal from the root of a project folder, the CLI tool automatically detects the framework in use. It installs the necessary SDK packages, drops the initialization configuration into the correct files, and wires up the project.
Manual Setup Process
For Python, Ruby, or JavaScript environments that require manual configuration, the setup relies on a standard three-line initialization.
The developer imports the library, calls an init() function, and provides their unique Data Source Name (DSN) key and the environment tag (e.g., 'production' or 'staging'). Once that function is called at the application's entry point, error capture is handled systematically. Developers can also manually capture errors inside try/catch blocks using a captureException() method, and attach specific user IDs to errors to track exactly who was impacted by a bug.
Configuration as Code via Terraform
For engineering teams that prefer to manage infrastructure as code, Tinymon offers an official Terraform Provider (terraform-provider-tinymon). Instead of manually clicking through the dashboard interface to add web endpoints or heartbeat schedules, teams can declaratively provision and update their alert channels, uptime targets, and cron thresholds inside standard .tf configuration files. This integrates into modern GitOps engineering pipelines.
7. Alert Routing and Triage Workflows
Capturing errors is only the first step; routing that information to the right person without causing alert fatigue is equally important. Tinymon features a highly customizable alerting engine.
Smart Alert Channels
Alerts can be routed to Email, Slack, Discord, or any custom HTTPS webhook. However, developers are not forced to send all alerts to all channels. Tinymon utilizes a rule-based routing system.
A team can establish rules based on severity, environment, or event counts. For example, a rule can dictate that errors occurring in the "staging" environment are only sent via email, while errors occurring in "production" are immediately pushed to a dedicated Slack channel.
Furthermore, to protect against noisy bugs, alerts are triggered primarily by state changes. You are notified when a new error appears, when a bug regresses, or when a specific milestone is hit (e.g., the 100th occurrence of an issue). Per-rule cooldowns and spike protection prevent a severely broken release from overloading an inbox or Slack workspace.
Release Tracking & Deployment Context
Beyond catching standalone exceptions, Tinymon supports dedicated Release Tracking. By injecting a git commit SHA or a semantic versioning string during the SDK's initialization stage, the dashboard maps captured errors directly onto your deployment timeline. When a sudden blast of anomalies surfaces, engineers can instantly correlate the bugs with a specific release build, shortening the time needed to safely roll back or patch changes.
Issue Triage and GitHub Integration
When an alert comes through, a developer can click the link to view the issue in the Tinymon dashboard. From there, they can review the stack trace and triage the bug.
Tinymon integrates directly with GitHub via Personal Access Tokens. From an error page, a developer can click a button to instantly generate a new GitHub Issue. The system automatically pre-fills the GitHub issue with the relevant stack trace, the release environment, and a back-link to the Tinymon dashboard. Alternatively, if a GitHub issue already exists for the bug, the developer can paste the URL to link them. Once linked, the open or closed status of the GitHub issue is mirrored within the Tinymon interface.
8. Pricing Model vs. Industry Standards
The most distinct differentiator between Tinymon and other monitoring solutions is its pricing philosophy. The platform is currently in beta (meaning it is free to use without a credit card), but its stated post-beta pricing model is highly transparent.
The Flat-Rate Subscription
Tinymon avoids complex tier structures and charges a single, flat rate of $9 per month (or $90 if billed annually).
This single plan includes the following core features:
- Unlimited Projects: You can track an infinite number of web apps, APIs, or side projects without the price increasing.
- Unlimited Team Members: There is no per-seat billing. You can invite your entire development team or co-founders at no extra cost.
- Core Monitoring Capabilities: Full access to standard uptime monitoring and cron heartbeat checks.
- Generous Error Allowance: Capture up to 50,000 error events per month.
- All Premium Features: Full access to GitHub integrations, source map uploads, and smart alerting rules.
Managing Error Volume Limits
The 50,000 monthly error limit is an important threshold to evaluate. For early-stage applications and solo developers, 50,000 unhandled exceptions per month is a massive volume. If an application is throwing that many errors, it typically indicates a critical systemic failure, an infinite loop, or a severely botched deployment.
Unlike some enterprise tools that automatically charge surprise overage fees when limits are exceeded, Tinymon handles overages collaboratively. If a project spikes above 50,000 errors, the platform rate-limits and samples the incoming data to protect your bill. The company explicitly states they will email the user to help track down the runaway loop rather than immediately pushing them to a higher tier. If an application legitimately scales to a point where its baseline error volume consistently exceeds 50,000 per month, Tinymon requires a manual conversation to work out a custom, higher-volume arrangement.
9. Limitations and When to Upgrade
Maintaining an objective review requires identifying the limitations of the software. Tinymon is explicitly designed not to serve enterprise organizations. There are several technical scenarios where a development team will outgrow Tinymon and should migrate to a heavier platform like Datadog, Sentry, or New Relic.
Distributed Tracing
Tinymon is built for monolithic applications or simple frontend/backend splits. It does not offer distributed tracing. If an organization uses a complex microservices architecture where a single user request bounces across six different internal APIs before returning a response, identifying where a bottleneck occurred requires distributed tracing. Tinymon cannot provide this.
Real User Monitoring (RUM) and Profiling
Tinymon captures hard exceptions and crashes. It does not measure performance. If a team needs to track how many milliseconds a specific database query takes to resolve, or they want session replay tools to watch a user's cursor movements to identify UX friction, they require an enterprise observability tool.
Enterprise Compliance
As teams scale and hire dedicated Site Reliability Engineers (SREs), they require specific administrative tools. Tinymon does not feature SAML/SSO integrations, complex audit logging, or Service Level Agreement (SLA) support contracts.
Tinymon's developers openly acknowledge these limitations. The product is positioned as the necessary bridge between launching a product and scaling to a point where a dedicated enterprise observability budget is justified.
10. Summary Conclusion
Application monitoring is a non-negotiable requirement for software deployment, but the barrier to entry has historically been high for independent developers. By consolidating error tracking, uptime monitoring, and cron job validation into a single, straightforward dashboard, Tinymon effectively solves the fragmentation problem.
The platform succeeds by aggressively trimming away enterprise-grade features that early-stage teams do not need, allowing them to offer a highly predictable, flat-rate pricing model. The developer experience is frictionless, the integration process takes mere minutes, and the smart alerting rules effectively combat alert fatigue.
While it is not designed for massive microservice architectures or teams requiring deep performance profiling, Tinymon delivers exactly what it promises: a reliable, unified safety net for the early days of shipping software, ensuring developers know exactly when their code breaks without demanding an enterprise budget.